Docker · Beginner · 10 min
Container exit codes 137, 139 and 143 explained
What exit code 143 (SIGTERM), 137 (SIGKILL, OOMKilled) and 139 mean in Docker and Kubernetes, who sent the signal, and the fix for each cause.
The exit code is the first evidence you get when a container stops, and it costs one command to read. This page maps each code to its usual cause, shows how to tell an out-of-memory kill from a stop by the runtime, and lists what to check next. Output was captured with Docker 29.1.3 on a WSL2 test machine.
On this page
- The number is a clue, not a diagnosis
- Read it in one command
- , 126 and 127: it never really started
- Docker exit code 137 is two different failures
- Exit code 143 and exit status 143 (SIGTERM) in Docker and Kubernetes
- Exit code 139: a crash inside the process
- The same numbers in Kubernetes
- A 30-second routine
- Verify the reading and roll back
The number is a clue, not a diagnosis
A container stops and docker ps -a shows Exited (137). The exit code is the first piece of evidence you have, and it costs one command to read. But the same number can have more than one cause, and some codes mean the container never really ran.
Linux exit statuses run from 0 to 255. A status above 128 means the process was killed by a signal, and the signal number is the code minus 128. That is how 137 becomes 128 + 9 (SIGKILL), 139 becomes 128 + 11 (SIGSEGV) and 143 becomes 128 + 15 (SIGTERM).
| Exit code | Usual meaning | Check first |
|---|---|---|
0 | The main process finished normally. Not a crash: it was a short-lived command, or it moved itself into the background | What the main process is supposed to be |
1 or another small number | The application started and then failed: bad configuration, missing dependency, unhandled exception | The logs |
125 | The Docker daemon could not run the container: a bad flag, or a name or port conflict | The error printed by docker run |
126 | The command was found but could not be executed | The execute bit, or a directory used as the command |
127 | The command was not found | The path, and whether the image has a shell |
137 | Killed by SIGKILL | OOMKilled, see below |
139 | Segmentation fault | The base image and native libraries |
143 | Terminated by SIGTERM: something asked it to stop | Who stopped it |
Read it in one command
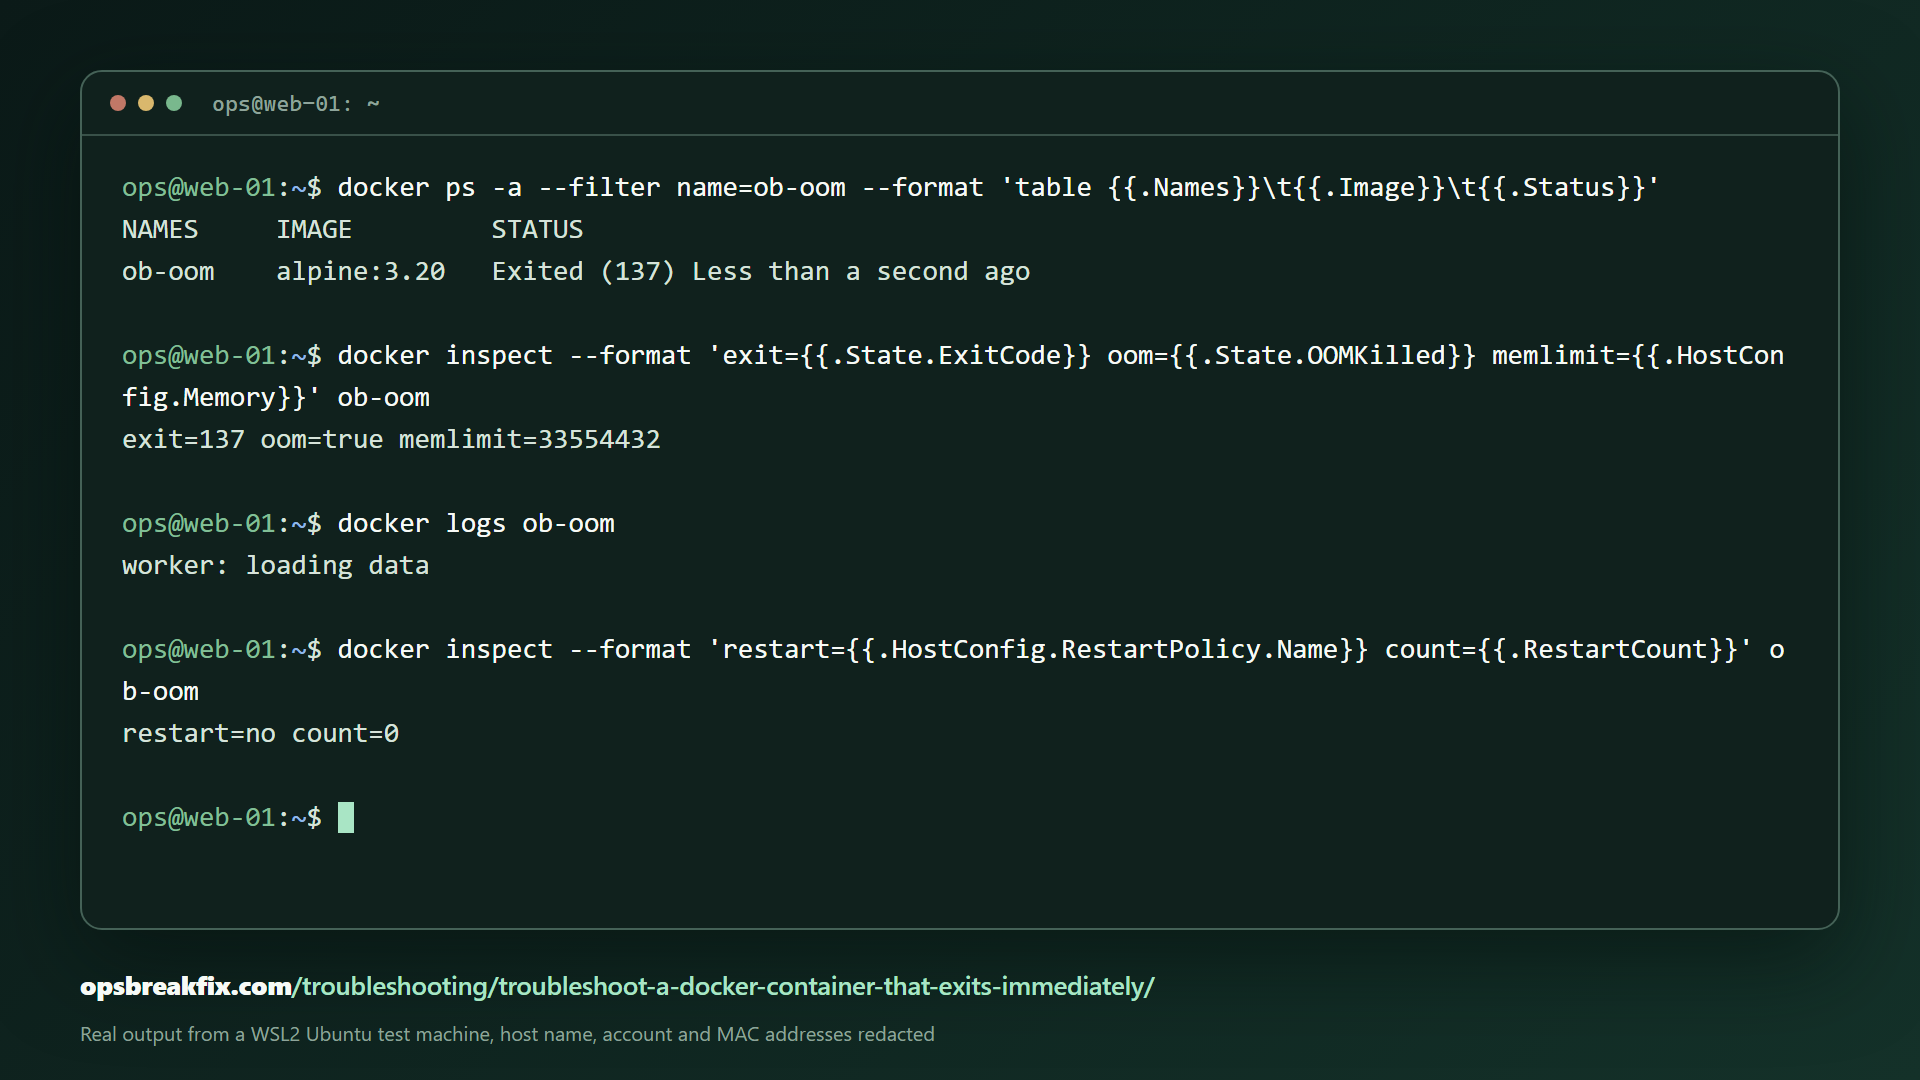
Do not guess from docker ps -a. Ask Docker for the exit code and the out-of-memory flag together:
# Exit code, out-of-memory flag and Docker error in one line
docker inspect --format 'exit={{.State.ExitCode}} oom={{.State.OOMKilled}} error={{.State.Error}}' CONTAINER
# Real output from a test machine (Docker 29.1.3)
exit=137 oom=true memlimit=33554432Then read what the application said before it stopped:
# The last 100 lines the application wrote
docker logs --tail 100 CONTAINER
An empty log does not mean a quiet service. The process may have been killed before it wrote anything, or it may write to a file inside the container instead of stdout.
125, 126 and 127: it never really started
These are start-up failures, not application crashes.
- 125: Docker itself could not run the container, for example because of a bad flag or a conflicting name or port.
docker runreports it. It is not stored in the container. - 126: the command exists but cannot be executed. Usually the script lacks the execute bit, or the path is a directory.
- 127: the command was not found. If the file exists and you still get
no such file or directory, see exec ... no such file or directory. A common trap is shell form.CMD ./start.shruns as/bin/sh -c ./start.sh, so an image without/bin/shfails with 127. The exec form,CMD ["./start.sh"], runs the file directly.
Docker exit code 137 is two different failures
Exit code 137 means SIGKILL, and SIGKILL has more than one sender. The oom= field tells them apart.
oom=true: the kernel killed it. The container went past its memory limit. Raise the limit deliberately (--memory 1g, or mem_limit in Compose), reduce what the application uses, or fix a leak. Do not raise the limit past the memory the host actually has free, because that only moves the failure to the host.
oom=false: someone else sent SIGKILL. The most common cause is docker stop or an orchestrator giving up. They send SIGTERM first, wait for the grace period (10 seconds by default), and then send SIGKILL. If your application ignores SIGTERM, it ends as 137 every time. The fix is to handle SIGTERM and to run the application as PID 1 in exec form.
Same number, opposite fixes. Raising the memory limit does nothing for a container that ignores SIGTERM.
Exit code 143 and exit status 143 (SIGTERM) in Docker and Kubernetes
"Exited (143)", exit status 143 and exit code 143 all mean the same thing: the main process received SIGTERM (128 + 15) and ended. That is a request to stop, not a crash. If your process traps SIGTERM and exits with 0, you will see 0 instead; 143 appears when the default signal action ended the process, or when the runtime reports a signal death. What matters is who sent the signal. A CI job, a cleanup script, an orchestrator or a person may have stopped the container. Ask Docker:
# Who stopped or killed this container in the last 30 minutes
docker events --since 30m --filter container=CONTAINER --filter event=die --filter event=kill
docker stop sends SIGTERM, waits 10 seconds by default (-t or --stop-timeout changes it) and then sends SIGKILL. That is why 143 and 137 come as a pair: a process that shuts down inside the grace period leaves 143 (or 0 if it handles the signal), and a process that does not leaves 137 with oom=false.
If a container usually ends as 143 but sometimes as 137, the stop sometimes takes longer than the grace period. The application is slow to shut down, or it never sees the signal. Check these causes in order:
- Shell-form
CMDorENTRYPOINT.CMD ./appruns/bin/sh -c ./app, and the shell becomes PID 1 and may not forward SIGTERM to the app. Use the exec form (CMD ["./app"]), orexec ./appin a wrapper script, so the application is PID 1 and receives the signal. - PID 1 signal handling. A process running as PID 1 gets no default signal actions, so without its own SIGTERM handler it ignores the signal until SIGKILL. Add a handler, or run the container with
docker run --init(orinit: truein Compose) to put a minimal init in front of it. - Slow shutdown. Draining connections or flushing a queue can exceed 10 seconds. Raise it deliberately with
docker stop -t 30,stop_grace_period: 30sin Compose, orSTOPSIGNALin the Dockerfile if the application expects a different signal.
Kubernetes exit code 143
In a Pod, Exit Code: 143 in kubectl describe pod (under Last State, Terminated) is the same SIGTERM. The kubelet sends SIGTERM when a Pod is deleted, a Deployment rolls out a new version, the Pod is scaled down or evicted, a node is drained, or a liveness or startup probe fails and the container is restarted. Then it waits terminationGracePeriodSeconds (30 seconds by default) and sends SIGKILL, which shows as 137.
# Last termination reason and exit code for every container in a Pod
kubectl get pod POD -o jsonpath='{range .status.containerStatuses[*]}{.name}{" "}{.lastState.terminated.reason}{" "}{.lastState.terminated.exitCode}{"\n"}{end}'
# Events show whether a probe, an eviction or a rollout caused the stop
kubectl describe pod POD | sed -n '/Events:/,$p'
A single 143 during a rollout or a drain is normal. A repeating 143 with Liveness probe failed events means the probe is killing a container that is not dead, so review the probe, not the application; see probes and resource limits. If the application needs more than 30 seconds to stop, raise terminationGracePeriodSeconds and, where needed, add a preStop hook. The hook runs inside the same grace period.
Exit code 139: a crash inside the process
139 is a segmentation fault. Look for a native library that does not match the base image, for example a binary built against glibc running on musl-based Alpine, and compare with a known-good image tag.
The same numbers in Kubernetes
Kubernetes reports the same exit codes, plus a reason. kubectl describe pod shows the last terminated state of each container:
| Reason and exit code | Meaning |
|---|---|
OOMKilled, 137 | The container exceeded its memory limit |
137 without OOMKilled | SIGKILL from elsewhere: a liveness kill after the grace period, a node-level out-of-memory event, or a manual kill |
| 143 | Graceful stop. If it repeats, a liveness or startup probe may be killing the container |
The detailed workflows are in the Kubernetes restarting Pod runbook and the guide to probes and resource limits.
kubectl exec and "command terminated with exit code 137". That line is not a Pod status. kubectl exec prints it when the command it ran inside the container ended with a non-zero code, and it passes the code on as its own exit status. On a kind cluster (kubectl 1.37, 6 November 2026), kubectl exec probe -- sh -c 'kill -9 $' printed command terminated with exit code 137 and exited 137, the same command with kill -15 printed command terminated with exit code 143 and exited 143, and exit 3 printed command terminated with exit code 3. The number follows the same 128 + signal rule as above, so 137 and 143 here mean the command was killed or asked to stop, not that the Pod crashed.
A 30-second routine
- Read the exit code and
oom=withdocker inspect. - 125 to 127: fix how the container is started, not the application.
- 137: check
oom=. True means memory. False means find who sent SIGKILL and whether the application handles SIGTERM. - 143: find out who stopped it with
docker events. - Read the last 100 log lines before you change anything.
- Change one thing, run it again and read the exit code once more. A restart without a diagnosis only hides the evidence.
The full diagnosis workflow, including the safe fixes and the rollback, is in the guide Troubleshoot a Docker container that exits immediately. For reading logs safely, see Inspect Docker containers and read their logs.
Sources: Docker run reference: exit status, docker container inspect, signal(7) manual page, Kubernetes Pod lifecycle.
Verify the reading and roll back
This page only reads state, so there is nothing to roll back here. The fixes that change something (a memory limit, a SIGTERM handler, a restart policy) and the way to undo each of them are in Troubleshoot a Docker container that exits immediately.
Before you act on a reading, confirm it with a second signal:
- For 137,
oom=truetogether with a memory limit on the container means the kernel killed it.oom=falsemeans someone sent SIGKILL: check whetherdocker stopor the orchestrator gave up after the grace period. - For 143,
docker eventsshows who stopped the container. - After a change, run the container again and read
exit=andoom=once more. The reading should differ; if it is the same number, the change did not touch the cause.
Official reference
Technical steps are original explanations; consult the upstream documentation for version-specific details.
Behavior differs by distribution and tool version. Commands are examples for authorized systems; review output for secrets before sharing.
Found this useful?
Follow us on YouTube for video explainers, and find us on Facebook to keep up with what is new.